By Dr. Bob Uttl (February 14, 2025)
apophenia : the tendency to perceive a connection or meaningful pattern between unrelated or random things
https://www.merriam-webster.com/dictionary/apophenia
Dr. Mary Westcott, supervised by Dr. Allan Mandel, President and owner of Mandel & Associates Ltd., had her technicians administer Ms. T fifteen test/test batteries that yielded over 1/2 thousand scores. Among the fifteen tests/test batteries, Dr. Westcott included Delis-Kaplan Executive System (D-KEFS) (Delis, Kaplan, & Kramer, 2001) — a battery of mostly unreliable tests designed to evaluate higher-order cognitive functions. Ms. T’s performance was overall about 1/2 standard deviation above the mean of the normative sample (corresponding to 107 on IQ scale with M = 100, SD = 15). However, rather than highlight in her report (Dr. Westcott’s September 15, 2010 Report) that Ms. T’s overall executive functions scores were above average, Dr. Westcott focused on three standard scores (out of nearly 30 scores) that were 1 standard deviation (SD) below the mean (7 on the D-KEFS standard scale with M = 10 and SD = 3, 16th percentile), opined that these three scores were “suggesting that she [Ms. T] may experience difficulties in these areas”, and proceeded to speculate how these three scores may be related to Ms. T’s alleged difficulties with her elementary school teacher duties. Yet, fifteen years later, Dr. Westcott admitted that she was unaware of any studies relating the performance on any of the tests that she used to the performance of elementary school teachers in the classroom.
Dr. Mary Westcott’s description of Ms. T’s performance on D-KEFS indicates that Dr. Westcott was either unaware of the unreliability of psychological test scores (and thus incompetent to conduct assessments using psychological tests) or she intentionally decided not to address the unreliability of psychological test scores and to pretend that they were infinitely accurate and reliable. Dr. Westcott did not mention that the three low scores she focused on were so unreliable that they were no different from the mean of the normative sample, not indicative of any difficulties, and reflected largely random error. Dr. Westcott cherry-picked these three “largely random error” low scores from nearly 30 D-KEFS primary scores.
Dr. Mary Westcott’s Description of Ms. T’s Performance On D-KEFS
Dr. Mary Westcott described Ms. T’s performance on the D-KEFS, a battery of tests measuring “executive functions” as follows:
Delis-Kaplan Executive System (D-KEFS)
The Delis-Kaplan Executive Function System {D-KEFS) consists of nine standardized tests for assessing higher level cognitive functions, often referred to as executive functions. Ms. T was administered eight tests from this battery (i.e., Trail Making, Verbal Fluency, Design Fluency, Color” Word Interference, Sorting, Tower Test, Proverb Test, and Word Context).
Ms. T demonstrated superior to below average executive functioning as measured by the D-KEFS. She demonstrated average letter sequencing, number sequencing, motor speed, verbal fluency, metaphorical thinking, planning, rule learning, verbal abstract reasoning, hypothesis testing, and deductive reasoning. She demonstrated above average design fluency and superior ability to generate words that begin with a given letter [otherwise known as “verbal fluency”]. These findings suggest no evidence of executive dysfunction in the above-mentioned domains. She performed in the Below Average range on tasks that Involved visual scanning, number-letter sequencing, inhibition of over-learned responses and cognitive flexibility suggesting that she may experience difficulties in these areas. It is interesting to note that Ms. T’s employers perceive that she seems unwilling to modify some of her teaching practices despite their repeated attempts to provide feedback. Such unwillingness could be related to difficulties with cognitive flexibility and/or a mild disinhibition of over-learned responses to particular situations or stressors.
Dr. Westcott September 15, 2010 Report
Dr. Westcott mentions about 15 tasks or areas of performance: 10 “average”, 1 “above average”, “1 superior” and 3 (or 4) “below average”. A reader may think, based on the above description, that Ms. T was “below average” on 3 (or perhaps 4 depending on how one interprets Dr. Westcott’s vague description) out of 15 tasks/areas, and that this is indicative that she “may experience difficulties in these areas”.
Dr. Westcott appears oblivious to more parsimonious alternative explanations for some lower scores: (a) random error due to poor reliability of tests she was using, and (b) natural variations of how individuals perform on various tasks.
A tell-tale sign of Dr. Westcott’s astonishing obliviousness is Dr. Westcott’s September 15 2010 Report itself. In her report, Dr. Westcott did not provide standard scores for any D-KEFS tasks, did not provide percentiles for any D-KEFS task, did not explain what she means by “Below Average”, did not provide 95% confidence intervals for any scores she observed, did not take into account base rates of low scores anywhere in her report, did not take into account how her selection of (unknown) cut-off scores for “Below Average” performance influenced the base rates of low scores. A test manual for another test, WAIS-IV CDN (Wechsler, 2008) Dr. Westcott used explains the necessity to consider reliability, standard error of measurement, confidence intervals, etc. when interpreting test scores in detail (see below).
The statistical properties of the WAIS-IV CDN determine the confidence pratitioners can have in the accuracy and precision of obtained scores. Psychometric properties that are critical to score interpretation include reliability and stability coefficients, standard errors of measurement, confidence intervals, statistical significance of differences between scores (critical values), and frequency of score differences (base rates) [emphasis added].
The standard error of measurement (SEM) provides an estimate of the amount of error in an individual’s observed test score. Because the SEM is inversely related to the reliability, as reliability increases, the SEM decreases, and confidence in the observed test score precision increases. Measurement error is commonly expressed in terms of standard score units; that is, the SEM is the SD of the measurement error distribution. The SEM is calculated with the formula:
SEM = SD * sqrt(1 – rxx)
where SEM represents the standard error of measurement, SD is the observed standard deviation of the scale, and rxx is the reliability ccoefficient of the scale…
The SEM is used to calculate the confidence interval, or the band of scores around the observed score, in which the individual’s true score is likely to fall. Confidence intervals express test score precision and serve as reminders that measurement error is inherent in all test scores and that observed test scores are only estimates of true ability.
Confidence intervals can be used to repor an individual’s score as an interval that is likely to contain the individual’s true score. For example, if an 18-year old examinee obtained an FSIQ score of 106, the practioner can be 95% confident that the individual’s true FSIQ score falls in the range of 100-112 (because the 95% confidence interval is 106 +/- 1.96 * SEM, where the SEM is 3.00)… Confidence intervals based on the SEM are calculate by the following formula:
p% Confidence Interval = Observed Score +/- Zp * SEM
where p is the confidence level, such as 90% or 95%, and Zp is the Z value associates with the confidence level, which can be located in normal probability tables [1.96 for 95% CI].
WAIS-IV Canadian Manual (Wechsler, 2008) (pp. 55-63)
If Dr. Westcott was competent in how to conduct assessments using psychological tests and in how to interpret psychological test scores, Dr. Westcott would know that (a) observed scores are imprecise and unreliable estimates of examinees’ true abilities, (b) a psychologist cannot claim that a score is below, for example, the average if 95% confidence interval for the observed score includes the average (only the junk science or pseudoscience practitioner who ignores science would claim that the score X is below the score Y without considering the reliability of the scores), and (c) some low (what she called “Below Average”) scores are common among a set of scores in perfectly normal, healthy normative sample, especially in such unreliable set of tests as D-KEFS tests are (Dellis et al., 2001; Zibulsky et al., 2014). However, Dr. Westcott’s September 15, 2010 Report does not even mention the reliabilities of tests she used and does not indicate that Dr. Westcott was even aware and understood that among 1/2 thousand scores she obtained in her assessment of Ms. T there would be many low scores due to random variation/chance alone.
Ms. T’s Actual Performance On D-KEFS
Ms. T’s performance on D-KEFS is summarized in the table below. The table includes test-retest reliabilities (r12), internal consistencies (rxx), D-KEFS Standard Scores (SS) (M = 10, SD = 3), IQ (M = 100, SD =15) equivalents of SS, percentiles (i.e., percentage of the normative sample scoring below Ms. T’s score), and 95% Confidence Intervals lower and upper bounds for IQ equivalents (95%CIlo, 95% CIhi). The 95% CIs were calculated from rxx and if not available, from r12.
| Test/ Condition | Test/Condition Description | r12 | rxx | SS | IQ | Pct | SEMIQ | 95%CI low | 95%CI hi |
| Trail Making Test | |||||||||
| TMT:VS | Condition 1: Visual Scanning | .55 | 7 | 85 | 16 | 10.06 | 65 | 105 | |
| TMT:NS | Condition 2: Number Sequencing | .54 | 12 | 110 | 75 | 10.17 | 90 | 130 | |
| TMT:LS | Condition 3: Letter Sequencing | .48 | 12 | 110 | 75 | 10.82 | 89 | 131 | |
| TMT:NLS | Condition 4: Number-Letter Switching | .36 | 7 | 85 | 16 | 12.00 | 61 | 109 | |
| TMT:MS | Condition 5: Motor Speed | .73 | 12 | 110 | 75 | 7.79 | 95 | 125 | |
| TMT:CNLS | Combined Number + Letter Sequencing | .64 | .78 | 13 | 115 | 84 | 7.04 | 101 | 129 |
| Verbal Fluency Test | |||||||||
| VFT:LFTC | Letter Fluency: Total Correct | .76 | .90 | 19 | 145 | 100 | 4.74 | 136 | 154 |
| VFT:CFTC | Category Fluency: Total Correct | .81 | .76 | 12 | 110 | 75 | 7.35 | 96 | 124 |
| VFT:CSTCR | Category Switching: Total Correct Responses | .49 | .68 | 10 | 100 | 50 | 8.49 | 83 | 117 |
| VFT:TSA | Category Switching: Total Switching Accuracy | .24 | .72 | 11 | 105 | 63 | 7.94 | 89 | 121 |
| Design Fluency Test | |||||||||
| DFT:FDTC | Condition 1 Filled Dots: Total Correct | .62 | 14 | 120 | 91 | 9.25 | 102 | 138 | |
| DFT:EDOTC | Condition 2 Empty Dots Only: Total Correct | .73 | 13 | 115 | 84 | 7.79 | 100 | 130 | |
| DFT:STC | Condition 3 Switching: Total Correct | .22 | 13 | 115 | 84 | 13.25 | 89 | 141 | |
| DFT:TC | Design Fluency Total Correct | 15 | 125 | 95 | |||||
| DFT:CFEDTC | Combined Filled + Empty Dots: Total Correct | 14 | 120 | 91 | |||||
| Color Word Interference Test | |||||||||
| CWIT:CN | Condition 1: Color Naming | .86 | 9 | 95 | 37 | 5.61 | 84 | 106 | |
| CWIT:WR | Condition 2: Word Reading | .49 | 12 | 110 | 75 | 10.71 | 89 | 131 | |
| CWIT:I | Condition 3: Inhibition | .71 | 10 | 100 | 50 | 8.08 | 84 | 116 | |
| CWIT:IS | Condition 4: Inhibition/Switching | .52 | 7 | 85 | 16 | 10.39 | 65 | 105 | |
| CWIT:CNR | Combined Naming + Reading | .75 | 11 | 105 | 63 | 7.50 | 90 | 120 | |
| Sorting Test | |||||||||
| ST:CCS | Confirmed Correct Sorts | .51 | .82 | 12 | 110 | 75 | 6.36 | 98 | 122 |
| ST:FSDS | Free Sorting Description Score | .46 | .83 | 12 | 110 | 75 | 6.18 | 98 | 122 |
| ST:SRDS | Sort Recognition Description Score | .55 | .77 | 9 | 95 | 37 | 7.19 | 81 | 109 |
| ST:CDS | Combined Description Score | 11 | 105 | 63 | |||||
| Word Context Test | |||||||||
| WCT:TCC | Total Consecutively Correct | .73 | .67 | 11 | 105 | 63 | 8.62 | 88 | 122 |
| Tower Test | |||||||||
| TT:TAS | Total Achievement Score | .41 | .72 | 11 | 105 | 63 | 7.94 | 89 | 121 |
| Proverb Test | |||||||||
| PT:TASFI | Total Achievement Score: Free Inquiry | .66 | .80 | 9 | 95 | 37 | 6.71 | 82 | 108 |
| PT:TASMC | Total Achievement Score: Multiple Score | 100 |
The Table above demonstrates that Dr. Westcott’s description of Ms. T’s D-KEFS performance and her interpretation of that performance was unreasonable, unscientific, and junk science:
First, going down the SS or IQ column, one can see that there are 21 scores at the mean of the normative sample (10 or 100, respectively) or above and only 6 scores below the mean of the normative sample. The average of all IQ scores listed in the IQ column is 107, indicating that on average, Ms. T’s executive skills were about 1/2 standard deviation above the mean of the normative sample. Clearly, an examinee’s performance 1/2 SD above the mean of the normative sample is not and cannot be evidence of deficits, impairments, or even difficulties with executive functions. Dr. Westcott had to sift through nearly 30 scores and cherry-pick the three lowest scores to support her claims of “below average” scores and “difficulties”. Notably, the three low scores — 85 on IQ scale or 7 or SS scale –were: TMT:VS, TMT:NLS, and CWIT:IS. The reliabilities of these three scores as reported in the D-KEFS manual (see the column r12 above) were: .54, .36, and .52. Anyone with a modicum of knowledge of the acceptable reliability would avoid interpreting these unreliable scores. It is widely understood that reliabilities above .80 indicate “good” reliability and, when tests are used in high-stakes testing, reliabilities ought to be above .90 (see excerpt below from Sattler (2008) below as one example) It appears Dr. Westcott is oblivious to what acceptable reliability is. Interpreting unreliable scores is practicing junk science and seeing meaning in randomness.
Reliability is essential in a psychological measure… Imagine a chaos if, when a student took two equivalent forms of the SAT on the same day, the student scored in the 85th percentile rank on one form and at the 40th percentile rank on the “equivalent” second form. Clearly, the reliability value of such a test would not be satisfactory. Reliabilities above .80 are preferred for tests used in individual assessment; reliabilities should be at or above .90 for test results to be useful in decision making.
The following are useful ways to describe reliability coefficients (Murphy & Davidshofer, 2005):
Sattler (2008, p. 110)
- .00 to .59: very low or very poor reliabilty
- .60 to .69: low or poor reliability
- .70 to .79: moderate or fair reliability
- .80 to .89: moderately high or good reliability
- .90 to .99: high or excellent reliability
Second, the SEMIQ column shows so called “standard error of measurement” or SEM in terms of IQ scores. The SEMs can be calculated directly from measures of reliability such as the test-retest reliabilities or internal consistency reliabilities using a simple formula: SEM = SD * sqrt(1 – rxx ) where the SD is the SD of the standardized scores (3 for SS scores and 15 for IQ scores) and rxx is reliability. Going down the SEM column, one can see that SEMs vary depending on the reliability of each specific score and range from 4.74 to 13.25. The SEMs are used to calculate so-called 95% Confidence Intervals for observed scores using another simple formula: Observed Score +/- 1.96 * SEM. The 95% Confidence Intervals indicate where an examine’s true scores (actual ability) is likely to lie given the observed scores (e.g., scores in the IQ columns). For example, Ms. T’s score of 85 on Trail Making Test Condition 1: Visual Scanning and 95%CI indicates that we can be 95% confident that Ms. T’s true score is somewhere between 65 and 105 (this particular score has very poor reliability and hence the 95% CI is very wide). Because the normative sample’s average is 100, and because the 95% Confidence Interval for the score of 85 includes 100, Dr. Westcott has no evidence whatsoever that Ms. T’s true score is below the average of the normative sample (100).
Third, going down the 95%CI hi column, one can see that ALL upper limits of 95% Confidence Intervals are ABOVE 100. Therefore, Dr. Westcott has zero evidence that Ms. T’s scores on any of the 24 scores for which reliabilities are listed in the D-KEFS manual are below the average of the normative sample. Hence, Dr. Westcott has zero scientific evidence to support her claim that Ms. T “may experience difficulties in these areas.” Dr. Westcott was interpreting random error as something meaningful. Just like “Quack Medicine”, “Quack Psychology” refers to practices that have “no scientifically plausible rationale behind them” (Amir-Azodi et al., 2024), in this case, Dr. Westcott interpreting randomness as meaningful. Clearly, random errors are not meaningful; if they were, one could replace a random error intepreting psychologist with a dice or a magic 8 ball.
Fourth, three observed scores equal to 85 is no evidence of “any difficulties in these areas.” Independently of unreliability of these scores, sixteen percent of the normal and healthy normative sample obtains scores lower than Ms. T by definition.
Fifth, different psychologists use different labels for the same performance/the same observed scores. Dr. Westcott used “below average” for the score of 85. Other psychologists, for example, those using WAIS-IV labels would describe this exact score as “low average” rather than “below average”. Accordingly, which labels one sees in a psychological report depends on which psychologist wrote the report. The failure of clinical psychologists to agree on score labels makes their descriptions of performance unreliable, unscientific, and junk science devoid of any meaning unless psychologists (a) report actual scores, (b) report 95% Confidence Intervals around obtained scores, and (c) report the meaning/the relationship between the labels and the standard scores (see Guilmette et al., 2020)
Finally, it has been known for decades that the more tests one gives, the more scores one obtains, and that the more scores one obtains, the more of those scores will be “low”. Furthermore, the more liberal cut-off for “low” scores one uses, the more “low” scores one will observe. Dr. Westcott used one of the most liberal definitions of low or “Below Average” scores, and thus, Dr. Westcott sees many low scores in any assessment she conducts purely due to chance alone.
Oddly enough, Dr. Westcott’s apophenia manifests itself only in Dr. Westcott’s interpretation of the meaning of low scores. With respect to Ms.T’s high scores, including extremely high scores (e.g., Letter Fluency: Total Correct), Dr. Westcott offered no interpretation of high scores. In turn, this suggests Dr. Westcott may be prone not only to apophenia but also to “deficit focus”, that is, looking for weaknesses rather than strengths in examinees’ performance.
Ms. T’s D-KEFS Performance Visualized
The figure below shows Ms. T’s performance on D-KEFS administered by Dr. Westcott’s technicians. Individual scores are denoted by black circle dots and 95% Confidence Interval for each score is shown by horizontal lines with terminating vertical marks.
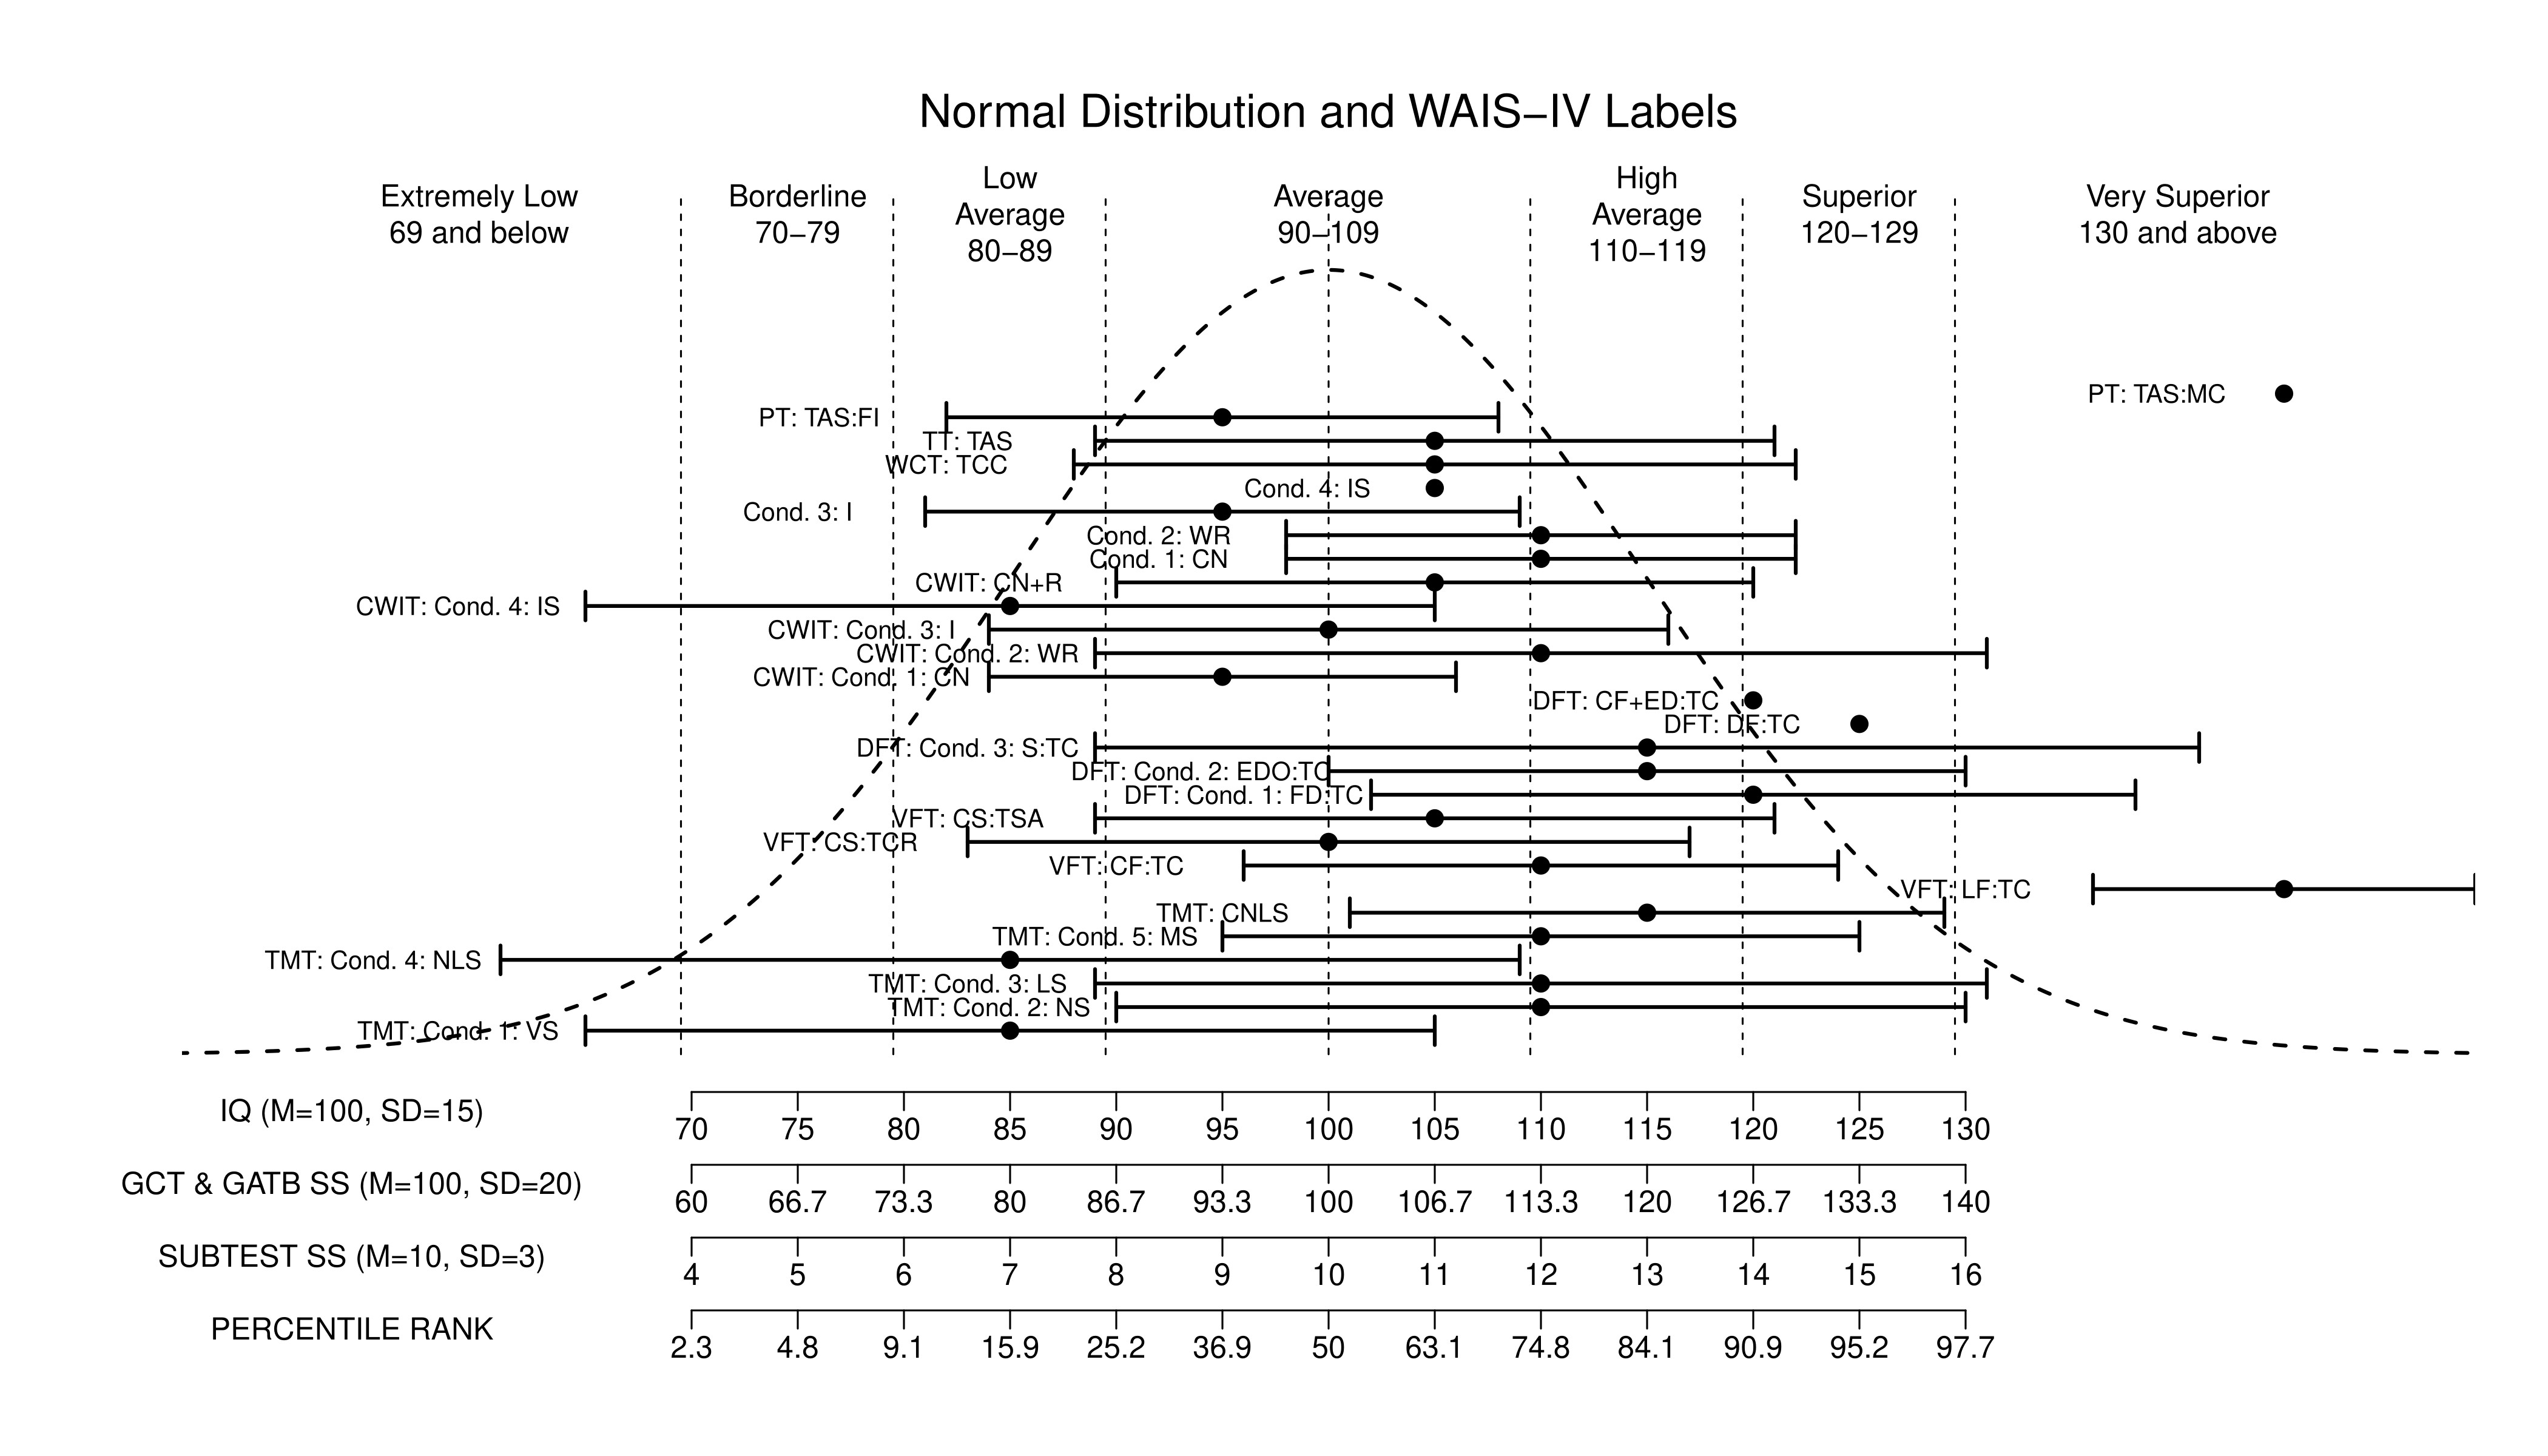
It should be obvious that none of the D-KEFS scores fell significantly below the average of the normative sample (100 on IQ scale or 10 on D-KEFS SS scale) (i.e., none of the 95% Confidence Intervals’ high limit terminates below 100). It is also obvious that the majority of Ms. T’s scores fell in the above-average half of the bell curve distribution. Without any calculations, just eyeballing these results makes it clear that the average executive function index score would be somewhere between 105 and 110.
Unfortunately, Dr. Westcott was oblivious to the fact that she was using unreliable tests and interpreting randomness as having some meaning, that is, that she was practicing junk science. If Dr. Westcott was a science-practitioner (as she ought to and is required to be), Dr. Westcott would take reliability, standard error of measurement, 95% confidence intervals, base rates of low scores, etc. into account before opining about the three lowest scores in the set of nearly 30 scores. Of course one must keep in mind that Dr. Westcott cannot even find a correct test manual and cannot even correctly categorize test scores, and thus, Dr. Westcott may not have sufficient ability (or perhaps does not care enough) to understand the scientific basis of psychological testing and concepts such as reliability, standard error of measurement, 95% confidence intervals, base rates of low scores, etc.
Ms. T’s D-KEFS Performance Analyzed By Crawford et al. (2011) Software
Below is the output of Crawford et al. (2011) D-KEFS Analysis Software that takes as input up to 16 D-KEFS Achievement Scores (a subset of the scores above), the definition of “abnormally low score”, and returns the “percentage of normal population expected to exhibit this number or more of abnormally low scores”.
According to Crawdord et al. (2011) software, the percentage of normal population expected to have 2 or more low scores (defined as SS scores of 7 or less) is 59.591%.
Moreover, the software also calculate overall D-KEFS Executive Index Score with 95% CIs. Ms. T’s Executive Index score (standardized with M = 100, SD = 15) is 109 with 95% CI = (100, 118) indicating no executive functions deficit whatsoever.
DKEFS_Supplementary_Analysis.EXE: Analysis of a case's profile of D-KEFS Achievement scores

 This program accompanies the paper by Crawford, J.R, Garthwaite, P.H., Sutherland, D., & Borland, N.
 (2011). Some supplementary methods for the analysis of the Delis-Kaplan Executive Function System.
 Psychological Assessment, 23, 888-898. (doi: 10.1037/a0023712)

 The case was identified as falling in the : 20-49 years age group
 Criterion for an abnormally low score was set at : 7 or less
 Number of achievement scores entered by user : 14 out of 16


 Reproduction of case's D-KEFS Achievement Subtest scores with their accompanying percentile ranks:
_______________________________________________________________________________________________________
 D-KEFS Achievement Subtest                                                     Score       PRank
_______________________________________________________________________________________________________

 Sorting Test, Condition 1: Free Sorting Confirmed Correct Sorts                  12        74.8
 Sorting Test, Condition 1: Free Sorting Description Score                        12        74.8
 Sorting Test, Condition 2: Sort Recognition Description Score                     9        36.9
 Trail Making Test, Condition 4 : Number-Letter Switching                          7        15.9
 Color-Word Interference Test, Condition 3: Inhibition                            10        50.0
 Color-Word Interference Test, Condition 4: Inhibition/Switching                   7        15.9
 Twenty Questions Test: Total Weighted Achievement Score                          --         --
 Verbal Fluency Test, Condition 1 : Letter Fluency Total Correct                  19        99.9
 Verbal Fluency Test, Condition 2 : Category Fluency Total Correct                12        74.8
 Verbal Fluency Test, Condition 3 : Category Switching Total Correct Responses    10        50.0
 Verbal Fluency Test, Condition 4 : Category Switching Total Switching Accuracy   11        63.1
 Design Fluency Test: Total Correct Composite Scaled Score                        15        95.2
 Tower Test: Total Achievement Score                                              11        63.1
 Tower Test: Move Accuracy Ratio                                                  --         --
 Word Context Test: Total Consecutively Correct                                   11        63.1
 Proverb Test, Total Achievement Score: Free Enquiry                               9        36.9
_______________________________________________________________________________________________________
 NUMBER of case's scores classified as abnormally low =  2
 PERCENTAGE of normal population expected to exhibit this number or more of abnormally low scores:
 Percentage = 59.591%


 MAHALANOBIS DISTANCE Index of the overall abnormality of the case's D-KEFS score profile:
 Chi-square = 22.196 on 14 df,  p value = 0.07468
 Estimated percentage of the normative population exhibiting a more unusual profile = 7.468%


 Case's D-KEFS Executive Index score (with accompanying confidence limits):
_______________________________________________________________________________________________________
 Index                    Index score       ( 95% CI on score )        PRank      ( 95% CI on PRank )
_______________________________________________________________________________________________________

 D-KEFS Executive Index:       109          (  100 to   118   )        72.6       ( 50.9  to  88.0  )
_______________________________________________________________________________________________________
 Reliability of the D-KEFS Executive Index for this particular combination of subtests = 0.913
 Standard error of measurement of the D-KEFS Executive Index for this combination of subtests = 4.416
.
Conclusions
Dr. Mary Wescott failed to follow the data to the only possible rational conclusion: Ms. T’s overall D-KEFS performance 1/2 SD above the mean of the normative sample did not and could not indicate any deficits in executive functioning. Astonishingly, Dr. Allan Mandel, Dr. Westcott supervisor who was secretly and without informed consent closely involved with Ms. T’s assessment including “quality control”, approved of Dr. Westcott’s September 15, 2010 Report. Neither Dr. Westcott nor Dr. Mandel appears to understand the unreliability of test scores, the need to examine 95% confidence intervals, and the need to take into account the base rates of low scores in a perfectly healthy normative sample before interpreting a few low scores.
Dr. Troy Janzen, Complaints Director and Deputy Registrar, College of Alberta Psychologist, stated that he personally reviewed all of the test scores. If he did, Dr. Janzen ought to have noticed that there was no basis for interpreting three lower scores from nearly 30 D-KEFS scores as “below average” and indicative of any “difficulties” with executive functions.
Cherry-picking and interpreting three low scores from the set of nearly 30 D-KEFS scores while ignoring the low reliabilities of these tests is practicing junk science rather than science.