By Dr. Bob Uttl
Joel Grey & Lisa Minnelli (video)
Money makes the world go around
The world go around
The world go around
Money makes the world go around
It makes the world go ‘round
A mark, a yen, a buck or a pound
A buck or a yen
A buck or a pound
Is all that make the world go around
That clinking, clanking sound
Can make the world go ‘round
Dr. John Braxton Suffield, an “expert” witness called to the witness stand by the School District No. 5 Southeast Kootenay (SD5), testified that he compared Ms. T’s Wechsler Adult Intelligence Scale IV (WAIS-IV) profile to the profiles of various groups detailed in WAIS-IV US Technical Manual and found that Ms. T’s WAIS-IV profile was “wildly different” from the matched controls, that is, the profile of the normal healthy adults. Dr. Suffield testified that this indicated to him that Ms. T’s intellectual data is “not normal data”.
… And there were 500 of those people, the aggregate of all the different control groups. And of all the comparisons that could be made, Ms. T’s data least resembled that control group of normal people. So I thought, you know, that was compelling evidence further to the hypothesis that her intellectual data is not normal. This is not normal data. She is wildly different in her level of performance and her pattern of performance from the normal subgroups…
Dr. John Braxton Suffield, Direct Under Oath Testimony
It turns out there was something seriously wrong — not normal — with Dr. John Braxton Suffield’s analyses and his opinions rather than with Ms. T’s intellectual data. In reality, Ms. T’s WAIS-IV profile was similar to the matched controls rather than “wildly different”. In fact, Dr. John Braxton Suffield himself wrote in his December 30, 2011 Report, that is about 15 years prior to his testimony, that Ms. T was a Canadian woman of average intelligence and cognitive abilities.
Dr. K’s summary (page 9), that Ms. T’s overall cognitive skills are average compared to similarly-aged Canadians, is correct…
Dr. John Braxton Suffield, December 30, 2011 Report, p. 16, para 3.5
What was wrong with Dr. John Braxton Suffield? Why did Dr. John Braxton Suffield changed his opinion and testimony? What caused Dr. John Braxton Suffield to testify, over the same data, that Ms. T was “wildly different” from”that control group of normal people” when about 15 years prior, Dr. Suffield wrote that Ms. T’s “overall cognitive skills” were “average”, that is, the average of the normal healthy people, and by extension, the normal controls
What kinds of steaming, bubbling cauldron was Dr. John Braxton Suffield hunched over when he came up with his opinion that Ms. T was “wildly different” from “the normal subgroup”? The steaming, bubbling cauldron Dr. John Braxton Suffield was looking into was Dr. David Crockett’s spreadsheet — one tool some psychologists use to come up with their opinions of clients.
Dr. David Crockett’s spreadsheet was theoretically designed to calculate profile similarity — using Cattell’s rp — of an examinee’s WAIS-IV profile to WAIS-IV profiles of the 13 groups and the “500 people matched to these 13 groups” in the WAIS-IV manual. Unfortunately, Dr. Crockett’s spreadsheet has never been peer-reviewed and, as I will demonstrate here, does not actually do what Dr. Crockett designed it to do. The spreadsheet is colloquially speaking, a big heaping pile of horseshit as detailed below. Moreover, Dr. John Braxton Suffield populated the spreadsheet with fabricated and impossible data, either deliberately or due to his astonishing incompetence (see below). Dr. David Crockett’s spreadsheet includes 6 tabs but here we are concerned only with the tab labeled “WAIS-IV to Reference Groups”. For critique, demonstration, and educational purposes only, these spreadsheets are available for readers to explore and to educate themselves about dangerous of spreadsheets: Dr. David Crockett’s spreadsheet with all six tabs and the spreadsheet with the WAIS-IV to Reference Group” tab only (the Tab used by Dr. Suffield to make his false disparaging statements about Ms. T).
Given Dr. John Braxton Suffield’s use of Dr. Crockett’s spreadsheet, Dr. John Braxton Suffield is not competent to practice neuropsychology because either (a) he is unable to think, unable to reason, and unable to understand what he is doing, in other words, astonishingly incompetent, or, alternatively, (b) he knows what he is doing, he knows what he is doing is wrong, but he is in it for money, a big pile of cash, and thus, his goal is to satisfy his customer, the School District No. 5 Southeast Kootenay (SD5), that is, to be their hired gun, their hired assassin.
Let’s look at the details.
Visualizing Profile Similarity: Which Profile Is Ms. T’s Profile Most “Wildly Different” From?
The first rule of data analysis is: Graph it, visualize it, look at it!
The figure below shows WAIS-IV Index Scores profiles for (a) Ms. T’s (Dr. K’s assessment) WAIS-IV US Norms Scored Profile, (b) Matched Controls (N = 500), (c) The two most extreme profiles within the data set considered by Dr. John Braxton Suffield: Intellectually Gifted (N = 34) and Intellectual Disability – Moderate Severity (N = 31); and (d) Mathematics Disorder (N = 41) Profiles.
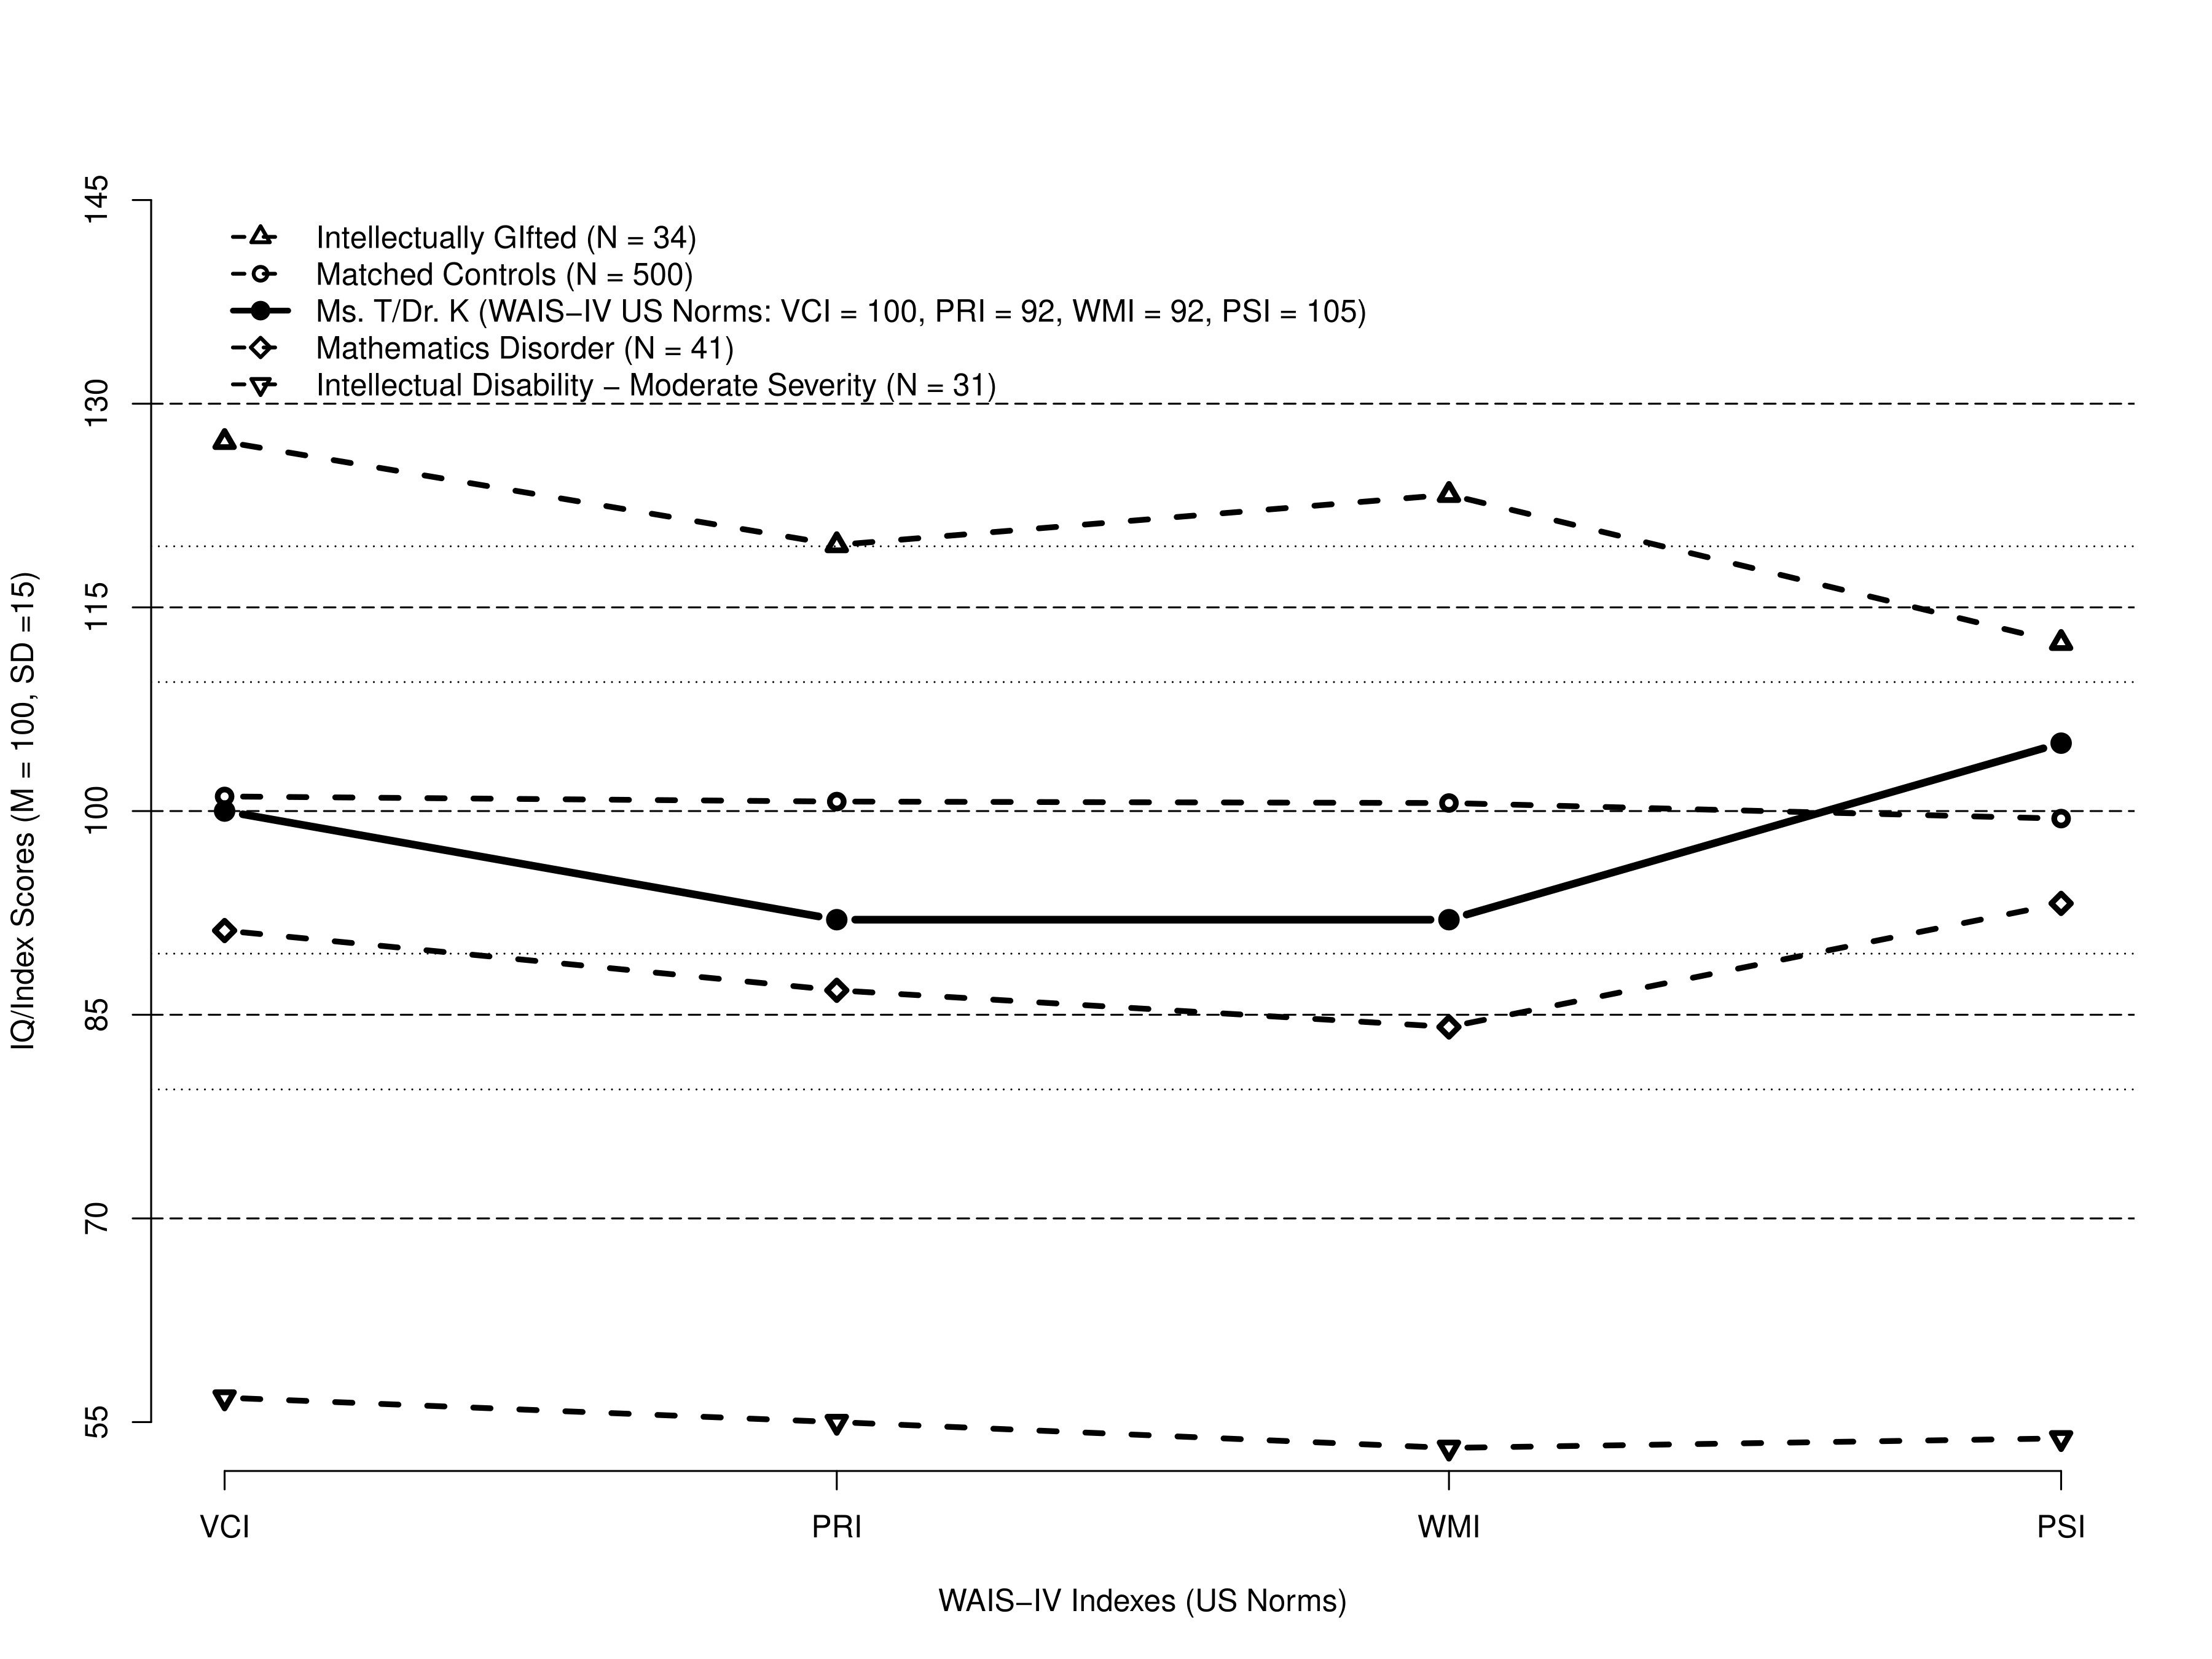
It should be obvious to anyone with reasonably adequate vision that Dr. John Braxton Suffield’s under oath testimony that Ms. T’s profile was the most dissimilar and “wildly different” from the Matched Controls’ profile was a fiction, baloney, astonishing nonsense. If anything, Ms. T’s profile is very similar to the Matched Control’s profile (Ms.T’s profile overall elevation is 97.3 IQ points whereas Matched Control’s profile elevation is 100.5 IQ points, a trivial difference of 3.1 IQ points) (note: 95% of Canadians score somewhere between 70 and 130 IQ points, the span of 60 IQ points). While Ms. T’s profile pattern appears to be more similar to the Mathematic Disorder than to the Matched Controls, the Mathematic Disorder profile elevation is 88.8 IQ points, about 8 IQ points below Ms. T’s profile elevation and 11.7 IQ points below the Matched Controls. Finally, the average elevation of the Intellectual Disability — Moderate Severity (N = 31) profile is 54.7 IQ points and the average elevation of the Intellectually Gifted is 120.6. If anything, Ms. T’s profile is “wildly different”, the most dissimilar from the Intellectually Disability — Moderate Severity Group whose average elevation was below 55 IQ points, more than 42 IQ points below Ms. T’s average elevation.
Moreover, to state the obvious, Ms. T’s WAIS-IV Full Scale IQ (FSIQ) using US Norms was 96 which is not significantly different from the Matched Controls IQ nor the age matched norms’ average (100). Hence, it cannot be “wildly different” from the Matched Controls.
If Dr. John Braxton Suffield did not visualize the data, if he did not understand that FSIQ of 96 is no different from FSIQ of 100, Dr. John Braxton Suffield was astonishingly incompetent, so incompetent that it appears impossible to find a word in English dictionary to describe this level of astonishing incompetence.
If Dr. John Braxton Suffield visualized the data, and if he understood that FSIQ 96 is no different from the average FSIQ of 100, a question is what was he smoking when he did his analyses and when he testified that Ms. T’s profile was “wildly different” from the Matched Controls? Whatever it was, it was really good as it severely compromised his vision and/or perceptual reasoning abilities and resulted in obvious hallucinations. Of course Dr. Suffield’s vision and perceptual reasoning abilities may have been clouded not by drugs but by large piles of cash that the SD5 has been providing him for his “expert” testimony.
Cattell’s rp: One Measure of Profile Similarity
To calculate profile similarities, Dr. Dave Crockett used so called Cattell’s rp, proosed by Cattell (1949) as a measure or coefficient of profile similarity calculated as
rp = (2k – SUM(d^2)) / (2k + SUM(d^2))
where k is the median for Chi-square with N degrees of freedom where N is the number of tests in the profile, d is the difference between corresponding scores on the two profiles at each test, expressed in standard scores or z-scores (i.e., scores standardized with M = 0, SD = 1) (Mosel, 1954; Livingston et al., 2003; Cattell et al., 1966). Cattell’s rp ranges from -1.0 to +1.0 where -1.0 indicates the asymptotic dissimilarity, 0 indicates complete lack of a relation, and +1 indicated perfect similarity.
It is critical to recognize that Cattell rp formula above is specific to/assumes standard scores with the mean of 0 and standard deviation of 1. This formula cannot be used with any other scores. This has been repeatedly emphasized in numerous scientific articles that detailed use of Cattell rp. For example, McCrae (2008), referring to Cattell rp and other measures of similarity, wrote:
In applying all these indexes, the metric of the profile elements is crucial. Both [Cattell] rp and rpa require z scores, standardized across the people in the sample, or using published norms.
McCrae (2008), p. 3
Accordingly, Cattell rp formula above is invalid for any other standardized scores such as WAIS Subset Scores (standardized with M = 10, SD = 3), and WAIS Summary/Index scores (standardized with M = 100, SD = 15).
In context of comparing Sixteen Personality Factor Questionnaire (16PF) profiles, Cattell, Eber, and Tatsuoka (1970, p. 141-142) provided a “refined” formula for comparing an individual profile to a group profile specific to sten scores, that is, the scores standardized with the mean of 5.5 and SD of 2, as
rp = (4*k +SUM(D^2) – SUM(d^2)) / (4*k +SUM(D^2) + SUM(d^2))
where k is the median for Chi-square with N degrees of freedom where N is the number of tests in the profile, d is the difference between corresponding scores on the individual and group profiles at each test, and D is the difference between the corresponding mean scores of the group profile and population mean profiles. In this formula, the profile variables are assumed to be standardized with SD = 2 rather than SD = 1, and the formula is invalid for any other standardized scores such as standard scores (M = 0, SD = 1), WAIS scaled scores (M = 10, SD = 3), and WAIS index scores (M = 100, SD = 15).
Although Cronbach and Glesser (1953) give more general Cattell’s rp formula that does not require the profile scores to be in the standard score (M = 0, SD = 1) form, this more general formula was not used in Dr. Crockett’s Cattell’s rp calculations.
Finally, Cattell’s rp makes certain further assumptions that are not satisfied by the WAIS-IV data.
Dr. David Crockett’s Spreadsheet Calculating Cattell’s rp Is Fatally Flawed
To support his patently false statement about Ms. T being “wildly different” from the normal Matched Controls, Dr. John Braxton Suffield used the spreadsheet designed by Dr. David Crockett in 2010, as noted above. Dr. Crockett designed the spreadsheets to ostensibly allow clinical psychologists such as Dr. John Braxton Suffield to compare clients’ scores to variety of groups and other scores.
Dr. David Crockett provided various cautions and warnings including:
- “The spreadsheet is provided for personal use only”,
- “Please retain all references to authors’ work”, and
- “Clinicians are encouraged to validate individual results.”
One of the spreadsheets, the tab named “WAIS-IV to Reference Groups”, allows clinicians to input a client’s WAIS-IV Subtest and Summary scores (index scores) to obtain various measures of profile similarity to a number of groups detailed in WAIS-IV US Technical Manual, including correlation (r), regression slope (Reg), distance (Dist), and Cattell’s rp, for both subtest score profiles and summary/index score profiles. The calculations of r, Reg, and Dist were likely taken from earlier spreadsheet prepared by Dr. Stewart Longman and they appear to be accurate. In contrast, the calculations of Cattell rps are spectacularly wrong, fatally flawed, indicating inadequate understanding on Dr. David Crockett’s part as to what he was doing and calculating.
Dr. David Crockett’s spreadsheet is available above, and for reasons detailed here, Dr. David Crockett’s spreadsheet ought NOT TO BE USED as it is fundamentally wrong and its use is likely to cause harm to examinees.
What are some of the fatal flaws of Dr. Crockett’s spreadsheet that render its calculations of Cattell rp patently invalid?
First Fatal Flaw: Dr. Crockett’s Spreadsheet Uses Wrong, Invalid Cattell rp Formula
The examination of Dr. Crockett’s spreadsheet shows that Dr. Crockett’s spreadsheet uses Cattell rp formula specific to sten scores standardized with M = 5.5 and SD = 2, and detailed above (Cattell, Eber, & Tatsuoka, 1970, p. 141-142). To illustrate:
- In the E76 cell, Cattell rp for Summary/Index Scores is calculated as follows: Cattell rp = (F74 + E75 – E74) / (F74 + E75 + E74) where F74 is 4*k, E75 is sum(D^2), and E74 is sum(d^2)
This same formula is used in all other calculations of Cattell rp (20+ times) in the spreadsheet over Scaled Scores (SD = 3) as well as Summary/Index Scores (SD = 15) resulting in patently wrong results because this Cattell rp formula assumes sten scores with the SD = 2 and is invalid for other standardized scores such as WAIS Subtest and Index Scores.
Second Fatal Flaw: Dr. Crockett’s Spreadsheet Erroneously Substituted Multiplications For Additions in the E66 Cell, the Matched Controls Comparison
The examination of the E66 cell shows that Dr. David Crockett’s spreadsheet uses the same wrong, invalid Cattell rp formula and adds another fatal flaw: the formula has multiplication signs instead of plus signs between the first two terms of the numerator and denominator.
Clearly, using multiplication where addition ought to be used is yet another fatal flaw invalidating calculation of Cattell rp for Subtest Scores for a client to Matched Controls profiles comparison.
Dr. Crockett’s Spreadsheet Results In Incorrect Cattell rps, Incorrect Profile Interpretations, And False Junk Science Opinions
As detailed above, Cattell rp formulas explicitly assume certain type of standardized scores, most frequently they assume the standard scores or so called z-scores (i.e., the scores with M = 0 and SD = 1), and can be used only with the assumed scores. Cattell rp formula designed for sten scores assumes sten scores and is valid only with sten scores. Notably, Cattell rp formula exists for variety of other scores but those formulas are more complex and include variances and covariances among profile variables.
Using Cattel rp formula for sten scores with other standardized scores results in incorrect Cattell’s rps, incorrect interpretations, junk science opinions, false under oath testimony, and often irreparable harm to clients/examinees and, in turn, irreparable harm to the reputations of clinical psychology.
To Dr. David Crockett’s credit:
- Dr. Crockett listed the sources/references to the key article including Cattell, Eber, & Tatsuoka (1970), Livingston et al. (2003), Horn et al. (1989) which should have been enough for a competent psychologist to realize the spreadsheet was fundamentally flawed, wrong, junk science, and not to be used.
- Dr. Crockett also cautioned users “to validate individual results”, that is, he reminded the users of their professional responsibility to validate the results including the calculations themselves.
Obviously, Dr. Crockett spreadsheet ought to be removed from the circulation to avoid further harm to clients and examinees. Psychologists who used this Crockett’s spreadsheet ought to make full effort to correct harm caused by their use of this spreadsheet including notifying all users/recipients of their reports. However, I make no comments on any other tab of Dr. David Crockett’s Excell spreadsheet file except this one tab “WAIS-IV to Reference Groups”. Other tabs may be accurate or they may also be completely wrong. I have contacted Dr. David Crockett at the email provided – crockettdj@hotmail.com – weeks ago about his spreadsheet but have not received any reply.
Dr. John Braxton Suffield’s Use of Dr. Crockett’s Spreadsheet: Incompetence On Steroids Or Work Of A Hired Gun, Hired Assassin?
Dr. John Braxton Suffield used Dr. David Crockett’s spreadsheet to make his astonishing and patently false claim that Ms. T’s WAIS-IV US norms scored profile was “wildly different” from the Matched Controls. Dr. Suffield’s use of the spreadsheeet is a demonstration of incompetence on steroids, or work of a hired gun, hired assassin providing their services for a big pile of cash.
What is wrong with Dr. John Braxton Suffield’s profile similarity analyses?
Dr. John Braxton Suffield Ignored Fatal Flaws In Dr. Crockett’s Spreadsheet
Dr. John Braxton Suffield did not mention the fatal flaws in Dr. David Crockett’s spreadsheet in his direct expert testimony. In turn, this suggests that Dr. Suffield was too incompetent to recognize that he was using fatally flawed tool (he likely did not read primary references provided by Dr. Crockett), or Dr. Suffield realized that the spreadsheet was fundamentally flawed but chose to use it nevertheless to make his customer — the SD5 — happy.
In any case, Dr. Suffield’s analyses of Ms. T’s profile similarity to various WAIS-IV US Groups using Dr. David Crockett’s spreadsheet are patently wrong, astonishing junk science, pure garbage masqueraded by Dr. Suffield as science.
Dr. John Braxton Suffield Failed To Remove Missing Data From Calculations of Cattell’s rps
Dr. John Braxton Suffield entered Ms. T’s scores into the cells B14 to B32 (cells for Subtest Scores) and B36 to B40 (cells for Index Scores). However, because Ms. T was not administered some WAIS-IV subtests, some subtest scores were missing. Accordingly, Dr. Suffield left the relevant cells for the missing scores B24 to B29 (cells for LN, FW, CO, CA, Pcom, BND Subtest Scores) blank (more precisely, Dr. Suffield likely deleted example data provided by Dr. Crockett). Since Dr. Crockett’s spreadsheet used formula to copy values entered in the cells B14 to B32 and B36 to B40 into all other comparison (20+ times) (e.g, cells B45 to B63 and B70 to B73), the values were copied to all other cells accurately except for the cells that were blank — the blank cells were copied as “0” (zeros). Dr. Crockett’s spreadsheet with Ms. T’s data is available here.
When the cell is blank, the Excel (and other spreadsheet) copies the blank as “0” by default. These artificial zeros have then become Ms. T’s scores on tests she never took, and were used in all of the Cattell rp computations in Dr. David Crockett’s spreadsheet including those comparing Ms. T’s performance to the Matched Controls.
Obviously, it is patently wrong to assign Ms. T scores of 0 for subtests she never took, subtests that were never administered to her.
It is even more than patently wrong because the scores on these subtests range from 1 to 19, with M = 10 and SD = 3, and scores of 0 are impossible. These zeros artificially and falsely described Ms. T performance on these tests as falling below the absolutely worst possible performance, below 0.13th percentile.
Dr. John Braxton Suffield did not correct over 80 (EIGHTY) impossible zero scores, and did not remove these missing values turned into impossible zeros from the Cattell rp’s calculations.
It seems impossible that a competent experienced neuropsychologist who presents himself to the Courts and Tribunals as an expert would not notice a long series of impossible zero scores in numerous profile comparisons Dr. Suffield was doing using Dr. David Crockett’s spreadsheet.
Dr. John Braxton Suffield‘s use of Dr. Crocket spreadsheet and Dr. Suffield’s imputation of impossible zeros to describe Ms. T’s performance indicates either (a) Dr. Suffield’s incompetence on steroids or (b) Dr. Suffield being a hired gun, a hired assassin to provide testimony the SD5 was seeking for a large pile of cash. There does not seem to be any other possible explanation for Dr. Suffield’s conduct except some far fetched hypotheses that Russian agents, KGB, or little green men who arrived in big shiny silver colored flying saucers made him do it.
Dr. John Braxton Suffield Failed To Correctly Enter Ms. T’s Scores Into The Spreadsheet
Dr. John Braxton Suffield did not even enter all of Ms. T’s Subtest Scores into Dr. Crockett’s spreadsheet accurately. Although the Letter-Number Sequencing (LN) Subtest Score in Dr. Suffield’s spreadsheet is shown as missing turned into impossible zero score, Ms. T’ obtained Letter-Number Sequencing (LN) Subset Score of 10, the exact average scaled score in Dr. K’s assessment.
Again, it is a duty of clinical psychologists to double check data entry accuracy, especially in high stakes assessment, especially when that entered score is then copied into another 10+ cells and used in over 10 comparisons, and especially if the psychologists then presents himself as an “expert” to the Court or Tribunal and testified about such scores, their interpretations, and opinions he drew from them.
Now we know that Dr. John Braxton Suffield’s under oath testimony was false, junk science, a lot of rubbish, with no basis in reality.
Dr. John Braxton Suffield Deleted A Reference To Livingston et al. (2003) Demonstrating That Subtest Profiles Were Not Clinically Useful
It is widely known, and reported in WAIS-IV Technical Manual, that WAIS-IV Subtest Scores are far less reliable than WAIS-IV Summary/Index scores, and that 95% Confidence Interval around Subtest Scores are very wide. In turn, Subtest Scores profiles are unstable and their interpretations are based largely on random variation of Subtest Scores.
Livingston et al. (2003) investigated stability of WAIS-III profiles empirically and concluded that they are indeed “unstable” and that they “provide a little useful information”:
Profile stability involves the consistency of a set of scores over time. That is, does a profile of scores change on retesting and does this change affect clinical decisions? While psychologists routinely examine the reliability of individual scores, little research has examined the stability of a profile or set of scores. The first study described in this paper examined potential measures of profile stability using a simulation computer program. The results suggest that several measures show promise in this context, particularly Cattell’s coefficient of pattern similarity (rp ), salient variable similarity index (S), and the D2 coefficient. In the second study, selected measures of profile stability were applied to Wechsler test–retest data. The results suggest that profiles composed of IQ and index scores demonstrate acceptable stability and can be usefully interpreted in clinical and research situations. However, subtest score profiles are inherently less stable and provide little useful clinical information [emphasis added].
Livingston, Jennings, Reynolds, & Grey (2003)
Surprisingly, three references were deleted from Dr. Crockett spreadsheet as modified and disclosed by Dr. John Braxton Suffield on April 1, 2025, including the reference to Livingston et al (2003). Why? Only explanation appears to be Dr. Suffield’s dishonesty, that is, Dr. Suffield’s desire to ensure that Ms. T’s agent (myself) and the Tribunal would not learn that the stability of the subtest profiles was empirically studied by Livingston et al. and that Livingston et al. found that the subtest profiles Dr. Suffield calculated “are inherently less stable and provide little useful clinical information”.
Thus, the final nail into Dr. John Braxton Suffield profile analyses coffin is that all of the Subtest Score profiles Dr. Suffield calculated were not useful in any case, even if they were based on reality rather than falsehoods, fabrications, and junk science.
Hands On Demonstrations
Dr. Crockett’s Spreadsheet: Different Standardized Scores Produce Wildly Different Cattell rps
The Crockett’s Spreadsheet — WAIS-IV to Reference Group Tab — includes WAIS-IV example client “DJC”. The client’s Subtest Scores range from 9 to 11 and the Index scores from 102 to 106. The client’s scores are average and Cattell rp for both Subtest Scores and Summary/Index scores ought to be fairly high, close to 1.0. Surprisingly, when this client is compared to the Matched Controls who are also average, Cattell rp for Subtest Scores is high .835 but Cattell rp for Summary/Index Scores is -.534 (negative), indicating that this average scoring client is both very similar (using Subtest Scores) and moderately dissimilar (using Summary/Index scores) to the average scoring Matched Controls.
The reason for this discrepancy is that Dr. Crockett’s spreadsheet uses formula that assumes sten scores but inputs Subtest Scores with SD of 3 and Summary/Index scores with SD of 15. In turn, the use of wrong standardizes scores as well as different standardized scores in Subtest vs. Summary/Index calculations results in incorrect, wildly different, nonsensical Cattell rp values.
If we translate both the client’s Subtest and Summary/Index scores to the sten scores (M = 5.5, SD = 2) the formula was designed for according to Cattell himself, Cattell rp for Subtest Scores increases from .835 to .929 indicating high profile similarity of the client to the Matched Controls, and Cattell rp for Summary/Index scores goes from negative -.534 to positive +.872 also indicating high profile similarity of the client to the Matched Controls. A reader can examine these calculation using the Crockett spreadsheet with the sten based calculations for the Matched Controls comparison added in a yellow highlighted block between cells G42 and K76 here.
The Crockett spreadsheet is yet another example of garbage in/garbage out problem. The use of different and inappropriate standardized scores results in contradictory Cattell rps where similar Cattell rps should be observed. The use of the same and appropriate standardized scores for the Cattell formula used (sten scores) results in similar (.929 and .872) rather than contradictory (-.534 and .835) Cattell rps.
Blank Cells Turning To Zeros Produce Garbage, Junk, Rotten Science, and Horrible Stench
It is well known that Excel and other spreadsheet simply copy “0” when the source cell is blank. Say the cell A1 is blank. If you enter formula “=A1” in the cell B1, the cell B1 will have “0”. When you then use the cell B1 for some calculations, “0” will be used in all of those calculations. This is another out of many facts that Dr. John Braxton Suffield appears not to understand and is completely oblivious to.
Here is a simple video demonstrating this fact as well as some solutions to the problem of blanks turning into zeros.
Let’s delete values in the cells B24 to B29 in the Crockett’s spreadsheet as if the client DJC was not administered these tests. The deletion inserts fabricated “0”s in cells B55 to B59, giving the client “DJC” impossible and fabricated 0 Subtest Scores on LN, FW, CO, CA, Pcom, and BND. In turn, the sum of the squared distances of the client’s scores from the Matched Controls increases ten fold, from 6.12 to 629.00 (cell E64), and Cattell rp goes from positive +.836 to negative -.804. Check the spreadsheet with the values in the cells B24 to B29 here.
This is how Dr. John Braxton Suffield obtained the non-sensical negative Cattell rp for Ms. T’s average WAIS-IV Subtest Scores and false “support” for his patently false claim that Ms. T’s profile was “wildly dissimilar” from the Matched Controls.
Conclusions
Dr. John Braxton Suffield under oath testimony about Ms. T was patently false, based on patently false data, invalid profile similarity formulas, incorrectly entered scores, and Dr.John Braxton Suffield assigning to Ms. T zero scores for tests she never took. Dr. John Braxton Suffield under oath testimony was junk science on steroids.
It is a clinical psychologist’s duty to use tools that are scientific, reliable, and valid for purposes that the clinical psychologist intends to use them for. Although Dr. David Crockett ought not to have released his fatally flawed spreadsheet, the responsibility for its use by Dr. John Braxton Suffield is Dr. John Braxton Suffield’s and no one else’s. It was Dr. John Braxton Suffield duty to examine primary references, to examine the calculations, and to determine whether or not they are accurate or wrong.
Similarly, Dr. John Braxton Suffield is solely responsible for incorrect entry of Ms. T’s LN Subtest Score and for imputing zeros to describe Ms. T’s performance on subtests she never took. It is no one else’s fault that all of the calculations of Cattell’s rps are patently wrong for each of these two reason alone, regardless of all other fatal flaws detailed above. When a clinical psychologist does not accurately enter scores and/or imputes zeros for tests that an examinee never took, the clinical psychologist is either astonishingly incompetent on steroids or has a big pile of cash to make for his “hired gun”, junk science assassination “psychological” “expert” services.
Dr. John Braxton Suffield ought to have known that the spreadsheet calculation must be wrong if he visualized the data. No reasonable person with adequate vision and minimal perceptual reasoning abilities could ever conclude that Ms. T’s profile was most dissimilar and “wildly dissimilar” to the Matched Controls while looking at the profile figure above.
Dr. John Braxton Suffield‘s under oath testimony that Ms. T’s was “wildly different in her level of performance and her pattern of performance from the normal subgroups, 500 people matched” was astonishing falsehood, baseless assassination of Ms. T’s intellect, regardless if it was due to Dr. John Braxton Suffield’s indescribable level of incompetence or due to Dr. John Braxton Suffield’s malicious intent fueled by visions of more and more cash from the School District No. 5 Southeast Kootenay, and by extension, British Columbia’s taxpayers.
Here is some entertaining introduction to forensic science/junk science: